POWERCENTER MONITORING Accelerator
Data Management Framework
")
Powercenter Monitoring Requirements
")
How to detect
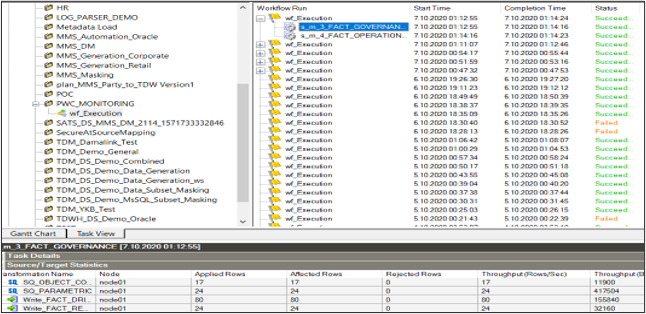
- Failed workflow/sessions?
- Rejected records in session?
- Sessions running less/longer than X/average?
- Sessions loading rows less/more than X/average?
- Zombie workflow/sessions?
- Successfully completed sessions but zero records loaded?
- Objects not matching naming conventions?
- Invalid Objects?
- Sessions with pushdown optimization active?
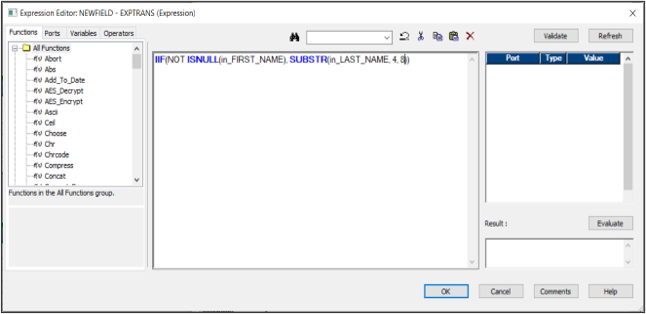
- Mappings with SQL-Override?
What ıs PowerCenter Monitoring Accelerator
- Works on Informatica PowerCenter
- Protect Data Integration environments with pre-defined and extendable rules and queries
- Identify issues and problems about all types of objects automatically
- Measure environment health with various categories
- Alert mechanism for highly critical errors
- Ready infrastructure to automate
PowerCenter Monitoring Accelerator High Level Architecture

What It Is Key Benefits?
Reduce Risk of Data Integration
- Detect DI issues before they become problems
- Provides a proper DI environment in Operational and Governance
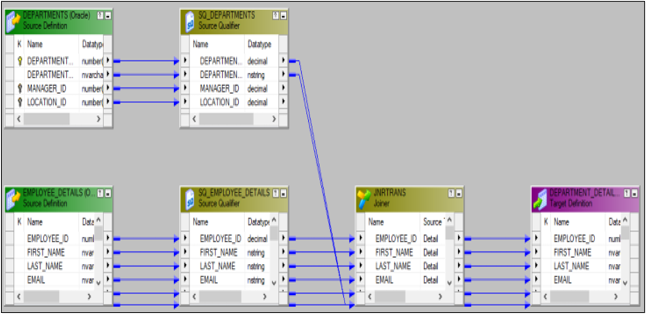
- Folders
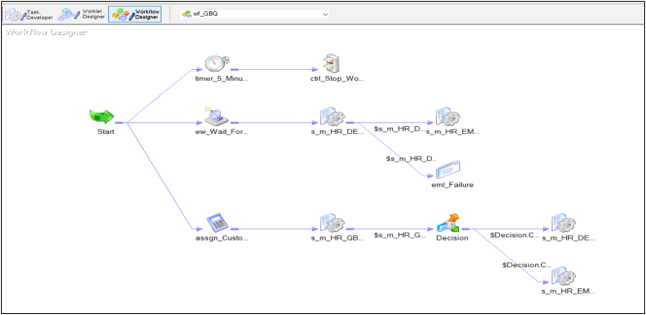
- Workflows
- Sessions
- Mapping
- Transformations
Enhance IT’s Productivity, Agility
- Speeding up detection for Operational or Governance problems
- Provides short response time
- Alert different teams or members based on rules
Monitor DI Processes and SLA’s
- Reduces cost of Monitoring
- Classify as Low and High Level Problems by set Weight and Threshold values to the rules
- Monitor patterns, trends and deviations
Rule Hierarchy

Operational Rules
Governance Rules
PowerCenter Monitoring Accelerator Approach
")